XLK's Breakout Above $154 — What the Historical Pattern Really Tells Us
Reporting on Tom Kranzle's technical analysis and the bullish case (with caveats) for tech leadership.
The Pattern That Happens Once Every 3–4 Years
Tom Kranzle just highlighted something worth your attention: XLK (the technology sector ETF) broke above $154 this week, closing at almost $162.
This matters because it's not random. Historically, when XLK makes a 20%+ move in 15 days and clears this level, only 30 instances have occurred in nearly a century. And when it happens, the historical track record is compelling: 80% success rate with 36% average gains over 12 months.
"XLK cleared that $154 hurdle that I've been hammering on for weeks," Kranzle notes. "The signal is confirmed and we are clearly in that bullish cohort."
This is institutional-grade conviction. And the data backs it up.
But here's where it gets interesting — and where the risk management kicks in.
The Problem: 14 of Those 30 Instances Marked Bear Market Tops
The uncomfortable truth embedded in Kranzle's analysis is right there if you look carefully.
Of the 30 historical instances where XLK cleared this level: 14 instances marked the top of the market before a bear phase.
That's 46% of the time. Nearly half.
So yes, 80% of the time you get the 36% rally. But 14/30 times, you get the rally and then a crash.
This doesn't invalidate the setup. It just means you need to structure your position for both outcomes.
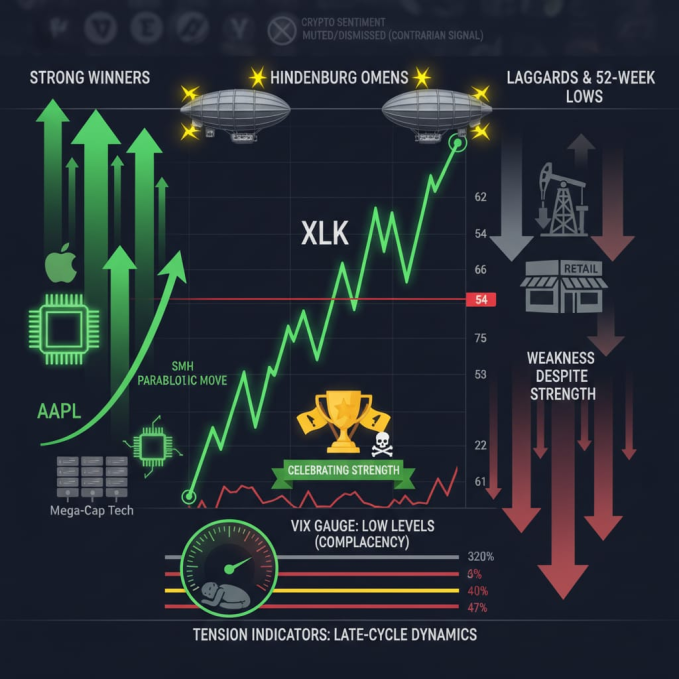
The Red Flags Flashing Underneath
Beyond the historical ambiguity, Kranzle flags several warning signals that suggest we're in late-cycle territory.
Hindenburg Omens firing: Multiple instances this week where markets are hitting record highs while simultaneously seeing record numbers of 52-week lows. This is classic late-cycle bifurcation — some stocks winning massively, others dying.
"We actually got several Hindenburg omens firing this week," Kranzle notes. "That speaks to a bifurcated market where some sectors are really hurting while others are thriving."
Semiconductor parabola (SMH up 41% in weeks): The semiconductor ETF has moved 41% in just a few weeks. This is not normal. This is the kind of vertical move that historically precedes sharp reversals.
"SMH is now up 41% in just a few weeks time, which is absolutely massive. What would be normal is seeing some periods of cool off consolidation or a pullback, which would be good to see to build structure."
VIX at historically low levels: Complacency is elevated. The volatility surface is priced for smooth sailing.
These are not bear market signals. But they are late-cycle signals. We're in the euphoric phase where everything works — but you need to be tactical about it.
The Trade Structure: Selective Momentum, Tactical Hedges
If you accept Kranzle's framework, positioning becomes nuanced.
Bullish plays (with confirmation):
- Long Apple (AAPL) — new CEO John Turnis starting in September, product-focused leadership could unlock the next leg
- Long semiconductors/infrastructure plays — earnings momentum building (SanDisk, WDC "absolutely crushed" recent earnings)
- Pair trades — long the winners (mega-cap tech), short the laggards (anything hitting 52-week lows despite market strength)
Tactical hedges:
- VIX call spreads — hedge against complacency when VIX is at 17 (historically low)
- SMH iron condor — profit from expected consolidation after the parabolic move
- AAPL LEAPS bull call spread — capture the multi-year setup with defined downside risk
Contrarian accumulation signal:
- Crypto (the most muted conversation topic on X, ranked above geopolitics and Iran) — this is peak pessimism and historically marks the beginning of a 3–6 month accumulation opportunity with 50–100% return potential through H2 2026
Why This Moment Matters
Kranzle's analysis captures something important: we're at an inflection point where the historical pattern is confirmed, but late-cycle dynamics are flashing.
This is not a "sell everything" signal. XLK breaking above $154 is genuinely bullish. The 80% historical success rate is real. The 36% average gain is achievable.
But it's also a moment where risk management becomes critical. Because 14/30 times, this exact setup precedes a correction.
The art is positioning for the 36% upside and having hedges in place for the inevitable volatility expansion.
The Crypto Wild Card
One insight from Kranzle's analysis deserves emphasis: crypto being the most muted topic on X is a contrarian signal.
When everyone checks out of an asset class — when sentiment reaches maximum dismissal — that's historically where accumulation begins. Not immediately. But within 3–6 months.
Bitcoin, Ethereum — these are likely accumulation opportunities if you're thinking on a 6–12 month horizon. The hate for crypto is real. The returns when sentiment shifts are also real.
What This Means for Your Portfolio
Short-term (0–3 months):
- XLK breakout is confirmed. Tactical momentum plays in confirmed breakouts make sense.
- But hedge via VIX calls. Protect your upside with defined risk structures.
- Play the bifurcation: long winners, short laggards.
Medium-term (3–12 months):
- Apple's new CEO setup (September) could unlock the next leg. Position for that.
- Semiconductors and AI infrastructure earnings are still flowing. Follow the momentum but watch for consolidation.
- Build a crypto accumulation plan if sentiment remains dismissive.
Risk management:
- We're in late-cycle territory. That doesn't mean sell. It means be selective.
- The 46% odds that this breakout precedes a correction shouldn't paralyze you. It should make you hedged.
- Use spreads. Use defined-risk structures. Don't go all-in on momentum.
The Bottom Line
Tom Kranzle is right about the XLK breakout. The pattern is confirmed. The historical precedent is bullish.
But he's also right to flag the red flags. Hindenburg omens, extreme RSI readings, bifurcated breadth — these are late-cycle symptoms.
The opportunity isn't to ignore one side or the other. It's to position for both. Go long the tech breakout. But do it tactically. Hedge the downside. Be ready for volatility.
That's how you capture the 36% upside without getting caught in the 46% of instances where the breakout precedes a crash.
This is reporting on Tom Kranzle's technical analysis. Nothing here is financial advice. Consult a licensed advisor before making investment decisions.
Lisa Tamati reports on markets, trading, and technology at PTLsignal.com
// newsletter
Want more like this?
Join the PTL Signal newsletter. Weekly AI, Bitcoin & market analysis from Lisa Tamati.